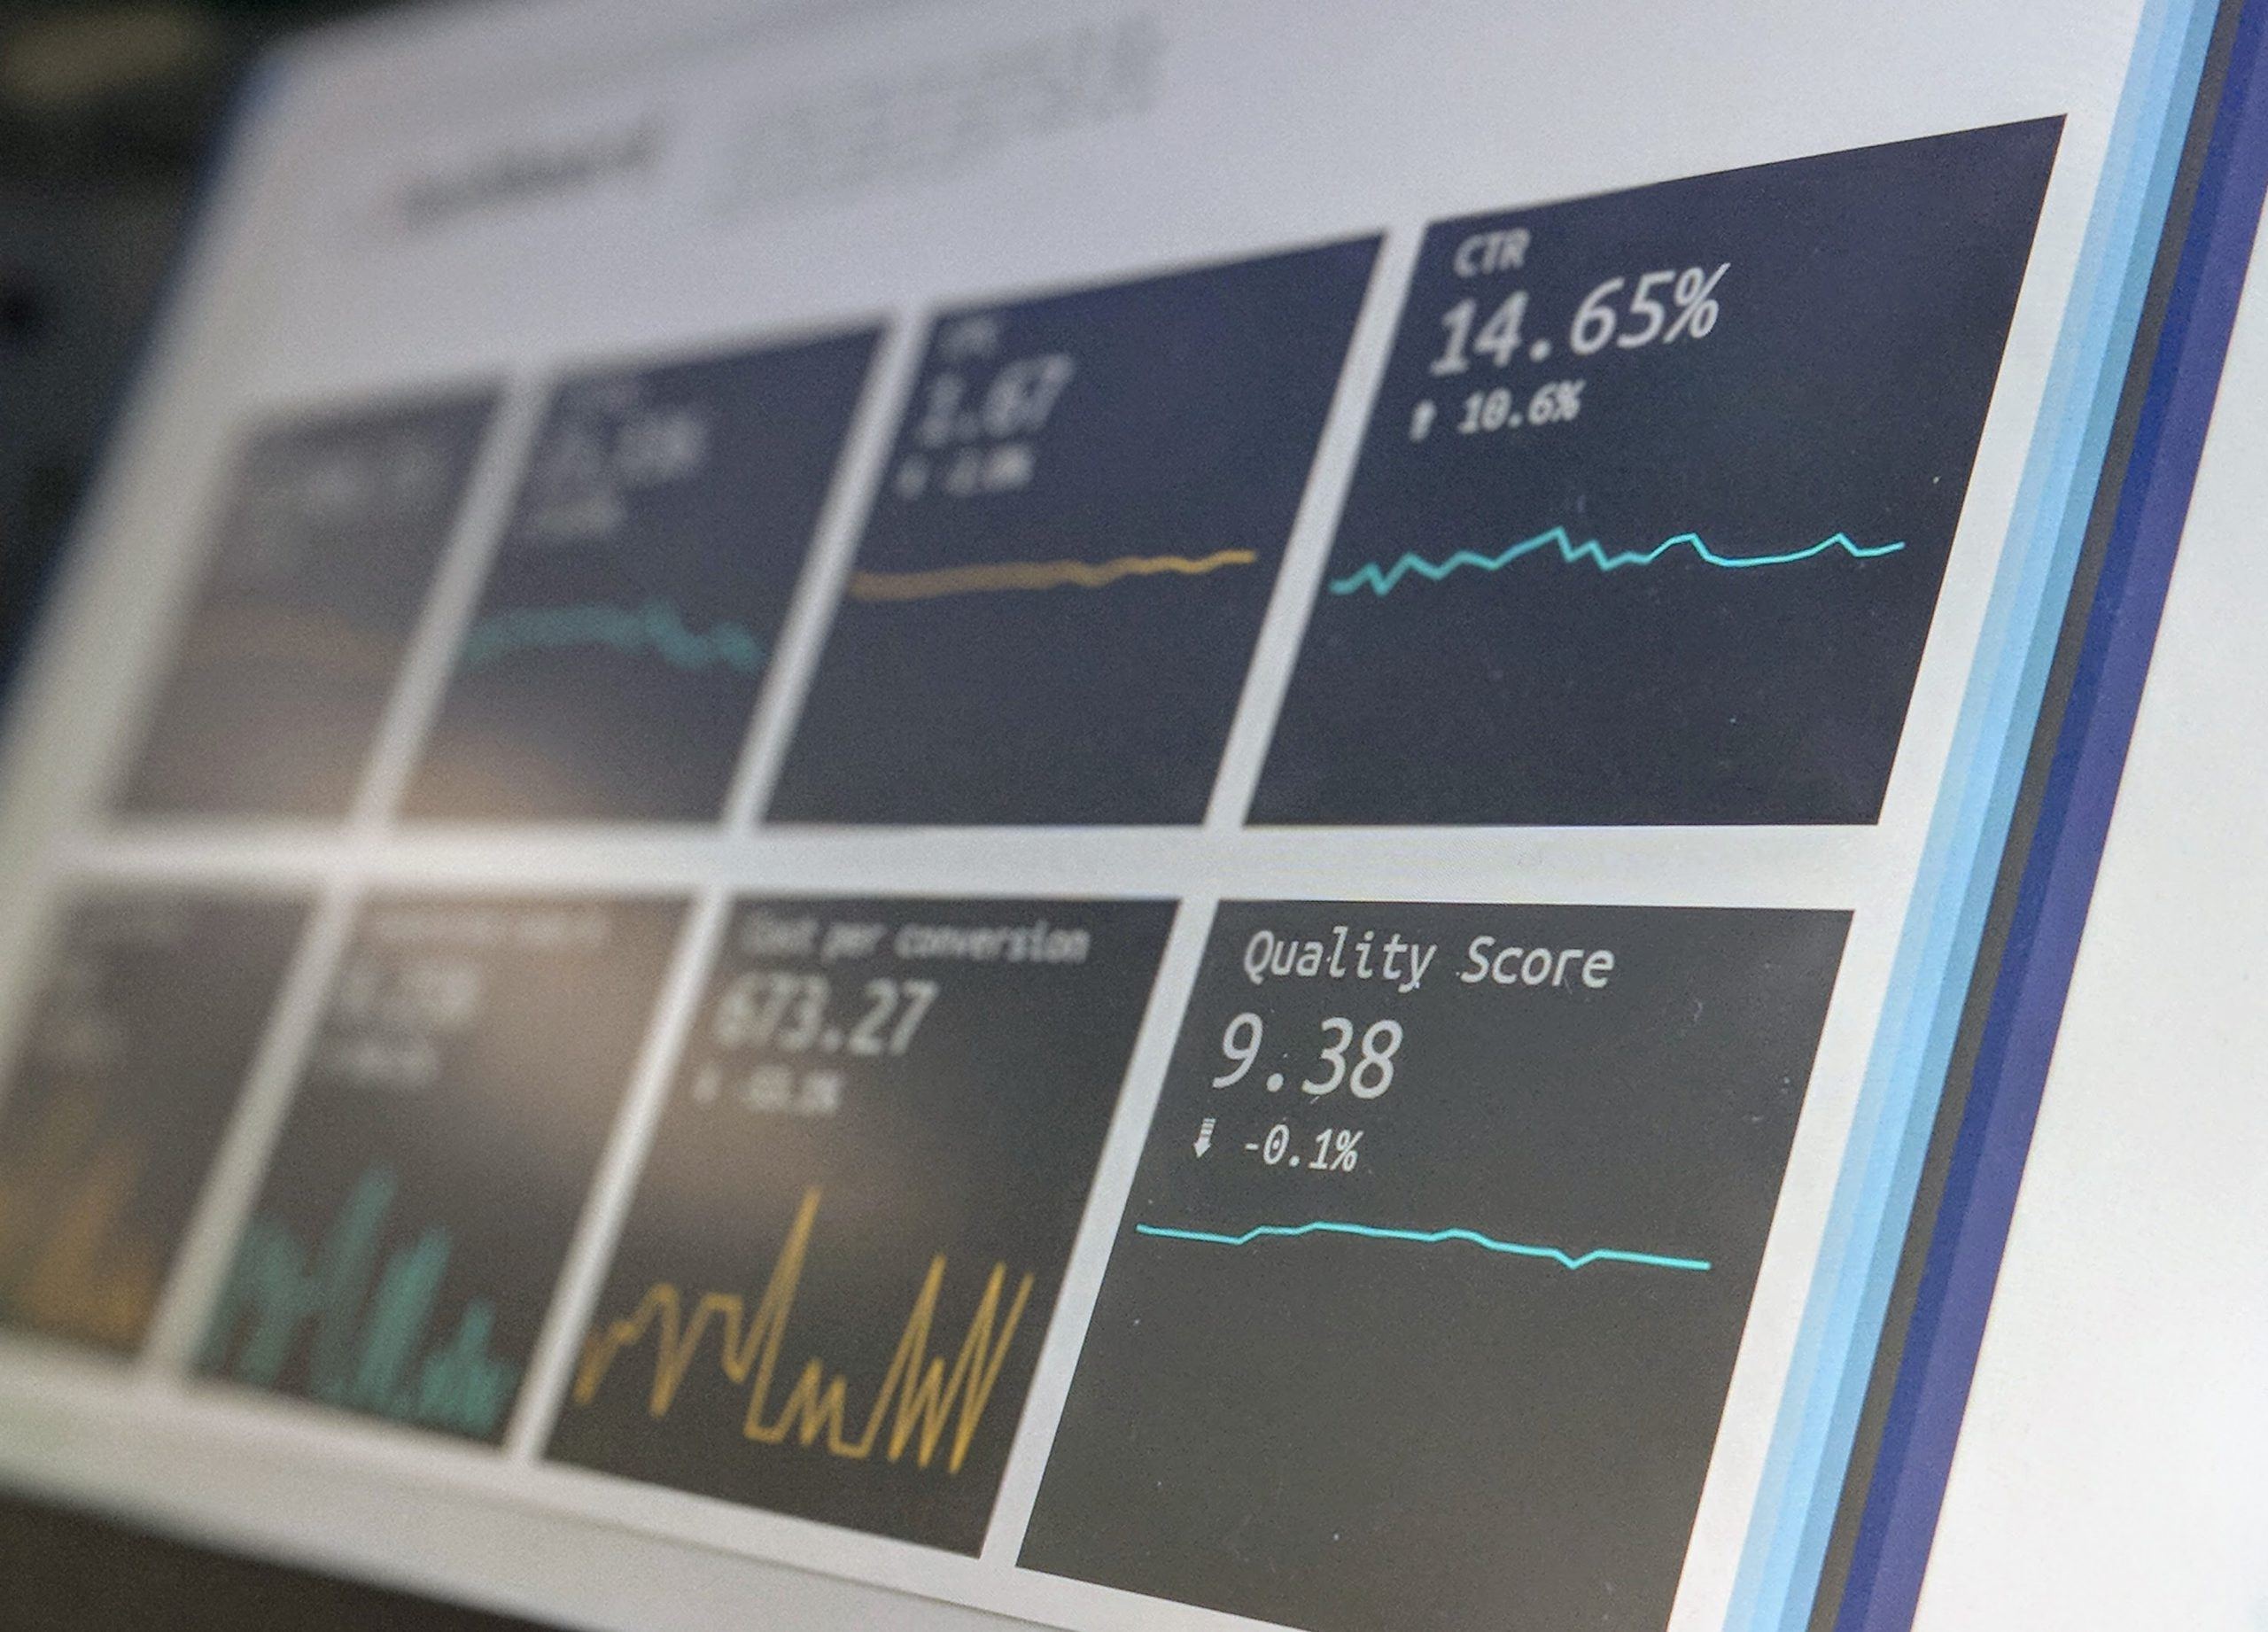
HR wears many hats in today’s business landscape. They’re responsible for recruiting, hiring, onboarding, training, payroll, benefits administration, compliance, and much more. But in order to be a true strategic partner in an organization, with a seat at the executive table, they need compelling data. And more than that, they need compelling ways to track and present data. That’s where dashboards come in.
DOWNLOAD THE E-BOOK: 51 Hacks to Become a Better Manager
An HR dashboard provides visual displays of workforce metrics. It pulls together information from all those different arenas we mentioned and organizes it into graphs and charts on one easily accessible, easy-to-read screen. These data visualizations allow you to monitor KPIs, trends, and progress. They give you the context and information you need to make data-driven decisions—and present evidence-based arguments for those decisions—without having to pore through spreadsheets or paper reports.
[bctt tweet=”HR dashboards help HR leaders make data-driven decisions without poring through spreadsheets.” username=”@reflektive”]
Dashboards are interactive, so you can drill down into the data you want to examine more closely. They provide a level of transparency among company leadership, giving everyone access to the same information and, hopefully, getting everyone on the same page when it comes time to make big decisions.
Rather than creating reports based on previous information, dashboards are automated, displaying data in real-time. They give HR professionals the capability to predict future behaviors based on machine learning algorithms, so that you can spot potential problems and address them before they affect the bottom line. Ultimately, dashboards are a tool to help HR operate proactively rather than reactively.
If you want to get the most out of HR dashboards, we suggest the following tips.
Pinpointing Problem Areas
Let’s say you’ve experienced irregularly high turnover lately. That can be an area that you focus on when customizing your dashboard. You would want to choose metrics that get to the heart of the turnover problem. You could break down recent ex-employees by position, age, demographic, department, or manager, then use this information to identify current employees who are at risk of leaving. You can then monitor these employees’ feedback, goal progress, surveys, and take steps to keep them in-house.
Focusing on Actionable Insights
Dashboards give you the ability to monitor numerous KPIs and data points. And with a beautiful interface that’s fun to look at, you may be tempted to monitor as much as possible. But that’s likely not the most efficient way to operate.
SEE ALSO: Managing a Multigenerational Workforce in the Age of The Millennial
Remember, dashboards provide you the information you need to take action. So, we recommend carefully selecting a handful of data visualizations that relate directly to the initiatives you’re working on. By narrowing your focus, you’ll be able to go deeper into the data, paint the most compelling picture of your workforce, and make HR decisions that align with your organization’s goals.
